View Metrics
This page walks you through the Metrics section and gets you started with monitoring your application. You’ll learn the following:
- What are application metrics
- How to use the Metrics section to see an overview of your applications
- How to view details about a specific application
This section uses the HotR.O.D sample application that comes preinstalled with SigNoz and generates sample data that you can query. You can apply the concepts and techniques you’ll learn to monitor your own applications.
Prerequisites
- This section assumes that your application is already instrumented. For details about how you can instrument your application, see the Instrument Your Application section.
- This section assumes that you are familiar with the basics of monitoring applications.
What Are Application Metrics
Application metrics represent a characteristic of your application as a value at a specific point in time. For example, an application metric is the number of requests per second your application serves. SigNoz collects information as a sequence of data points every minute and then represents the data through time in a graphical form. The X-axis is time, and the Y-axis is the value.
The Metrics section relies on the rate, errors, and duration (”RED”) method to help you predict the experience of your users and includes the following keys metrics:
- P99 Latency: the amount of time your application spends processing each of the fastest 99% of requests. For example, if the value of the
P99latency is 760 ms, 99% percent of requests have responses that are equal to or faster than 760 ms. - Error Rate: the number of failing requests per second.
- Requests per Second: the number of requests your application processes per second.
Open the Metrics Section
From the sidebar, select Metrics:
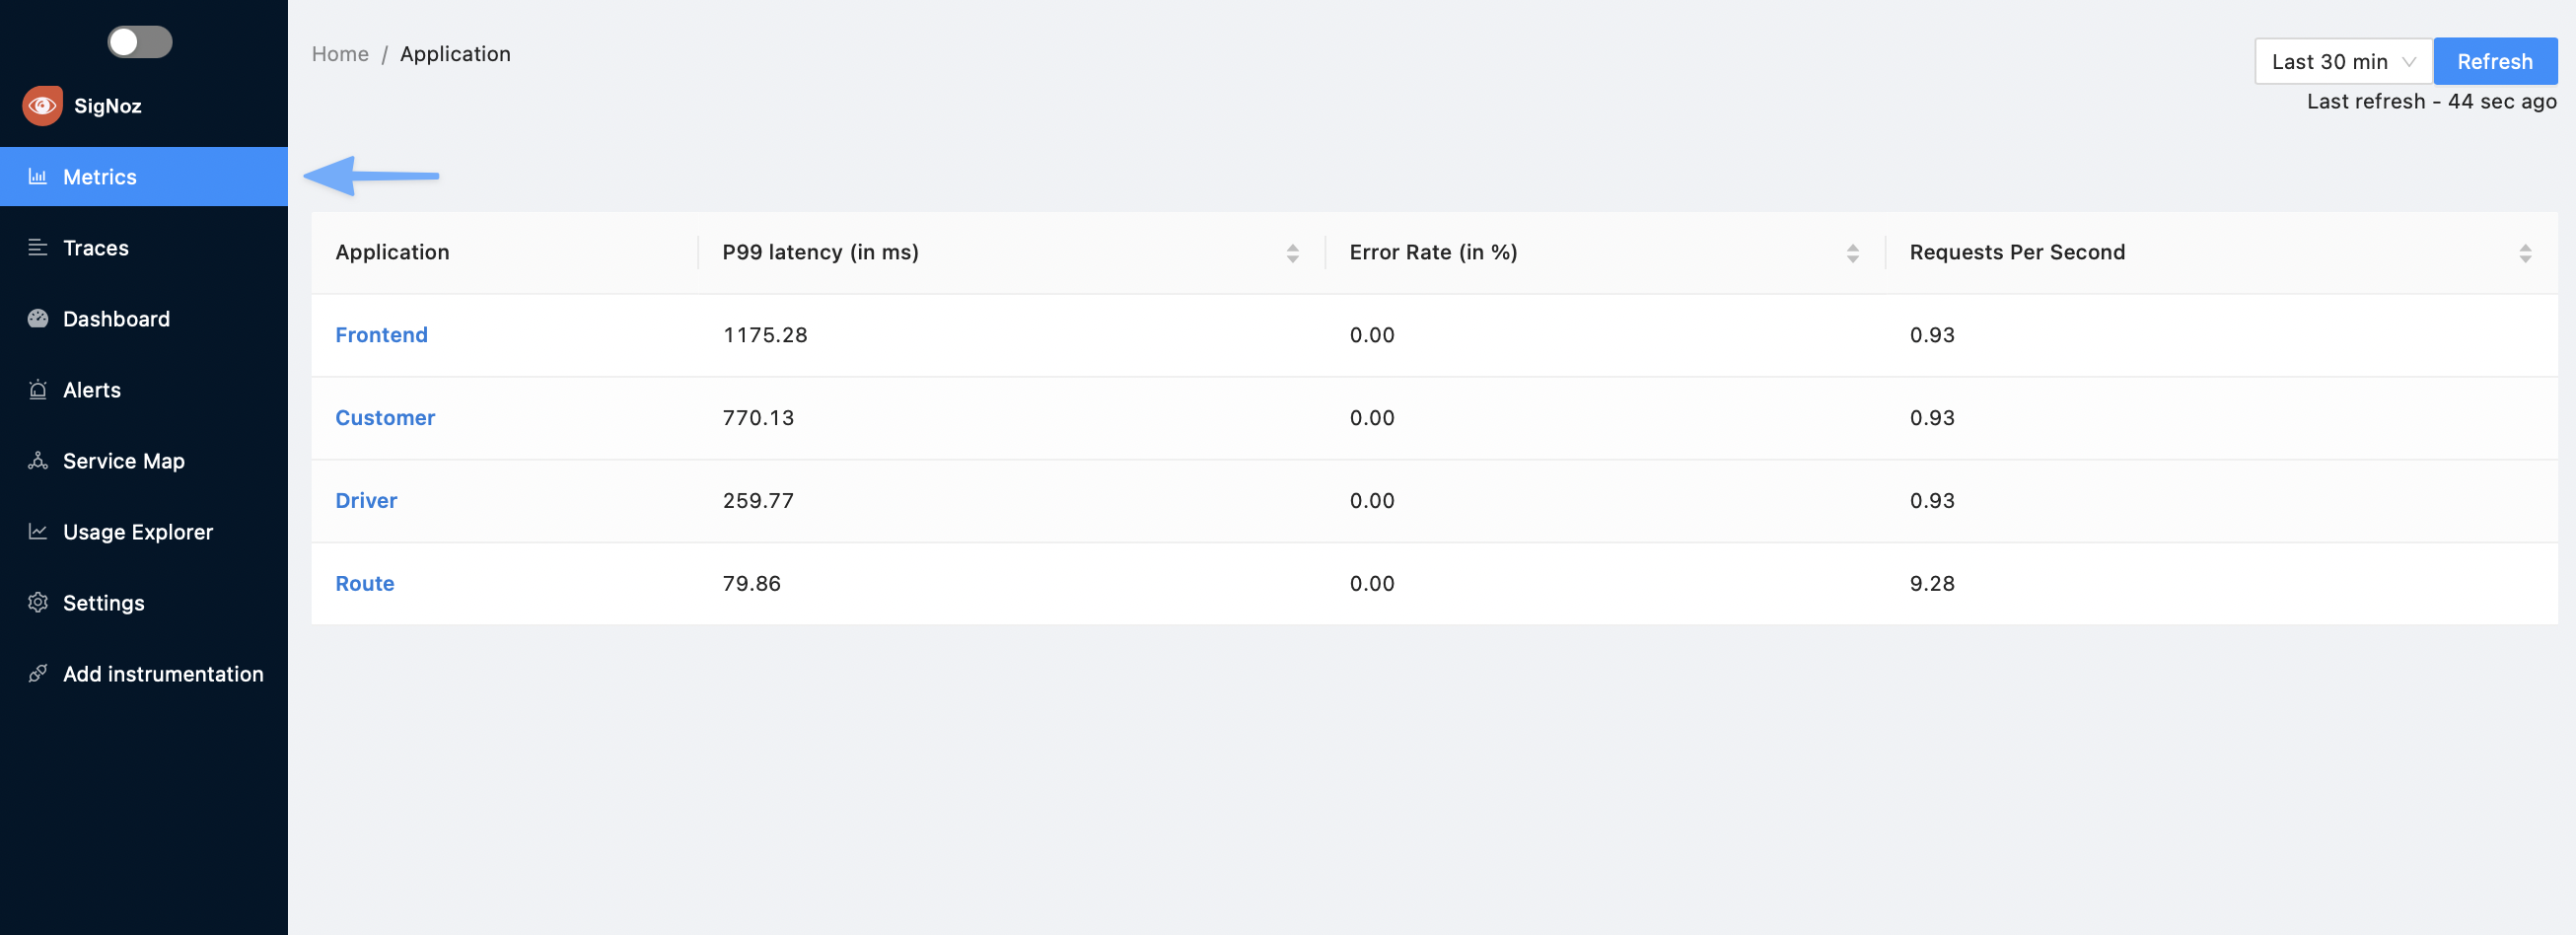
This page provides an overview of your applications’ health and performance. It shows the list of your applications formatted as a table and, for each application, SigNoz displays the RED metrics mentioned above.
The services list only shows services which are serving API calls. If a service is only making client calls to APIs of other services, it will not be shown in the services list page
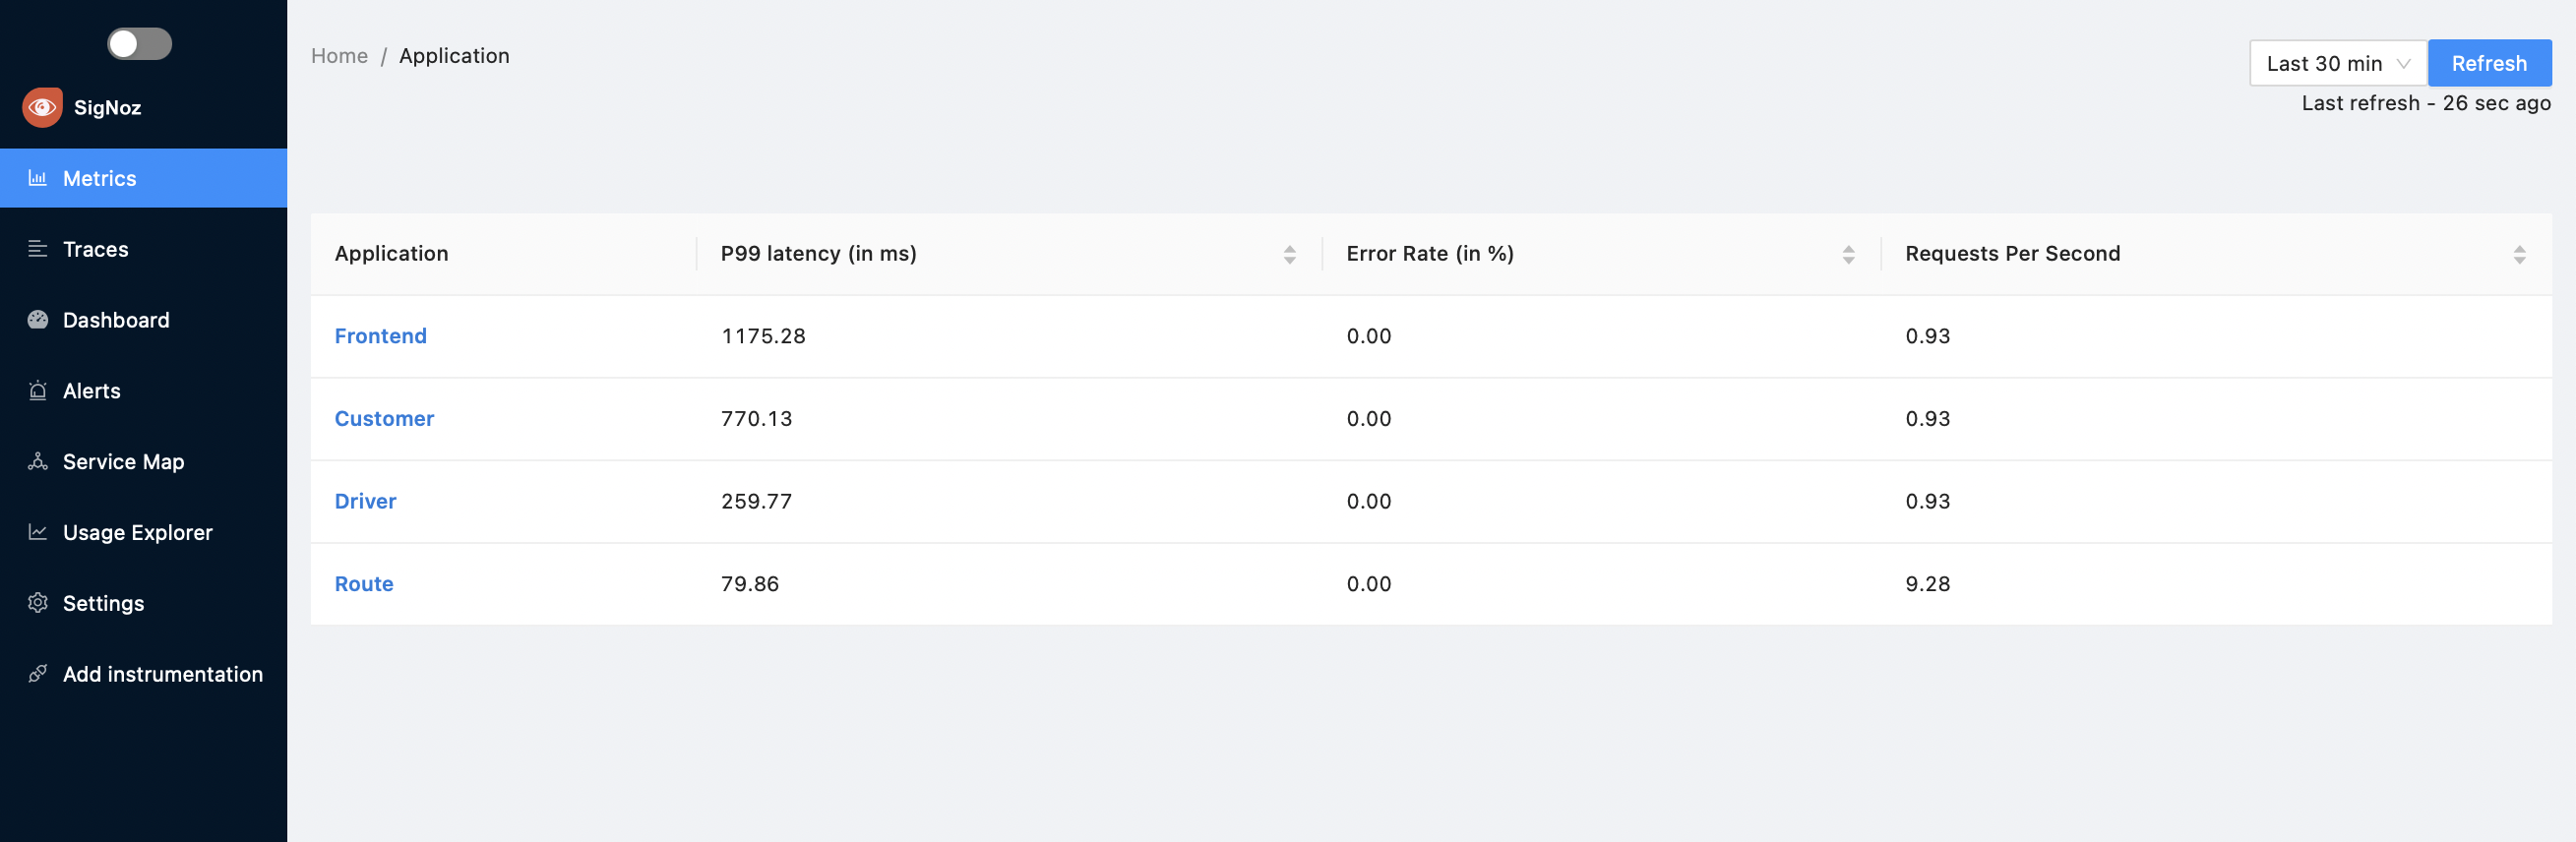
Sort the List of Applications
Select a column heading to sort the list by the values in that column. Select the column heading again to reverse the sort order or to cancel sorting.
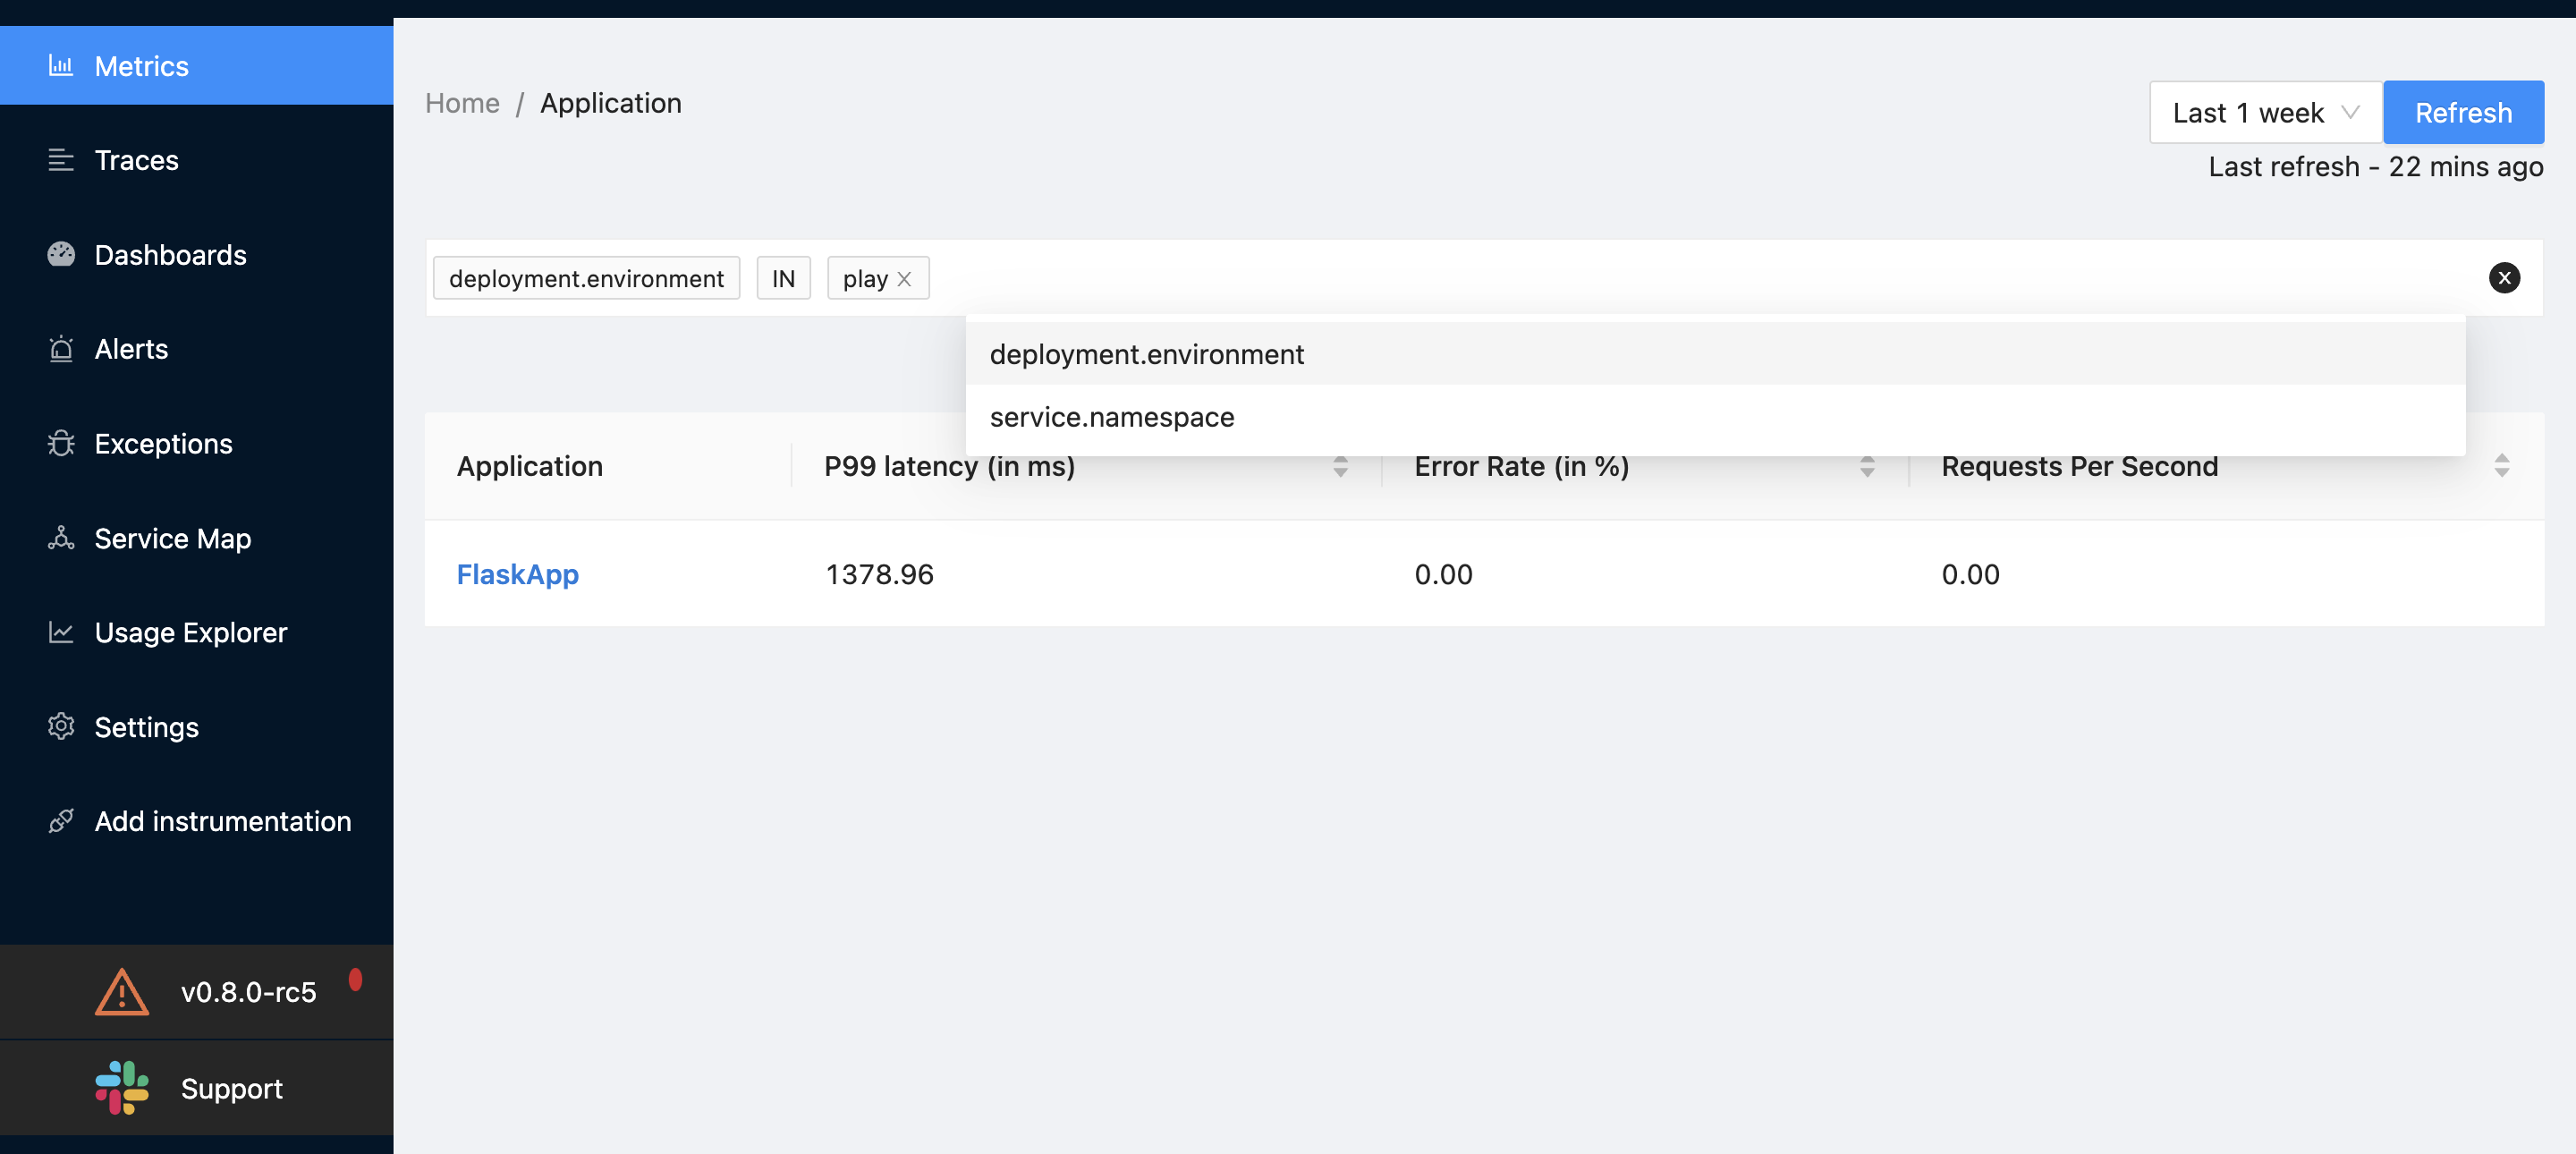
Filter the List of Applications
You can add attributes to applications and filter based on these attributes.
Steps to add resource attributes
You can add attributes as OTEL_RESOURCE_ATTRIBUTES flag when starting the application. The below example shows how to set values for service.namespace and deployment.environment
For example
OTEL_RESOURCE_ATTRIBUTES="service.name=flaskApp,service.namespace=sampleapps,deployment.environment=play" OTEL_EXPORTER_OTLP_ENDPOINT="http://3.11.144.34:4317" opentelemetry-instrument python3 app.py
By default, you can filter based on service.namespace and deployment.environment dimensions.
To add another dimension, update the dimension fields at https://github.com/SigNoz/signoz/blob/develop/deploy/docker/clickhouse-setup/otel-collector-config.yaml#L34 and then deploy the yaml file again.
View Details About an Application
The RED metrics help you spot performance bottlenecks or failures across all your applications. For example, if the error rate of an application increases, you can assume that these errors will impact the experience of your customers. Once you’ve identified a potential issue, select a row to open the application details page:
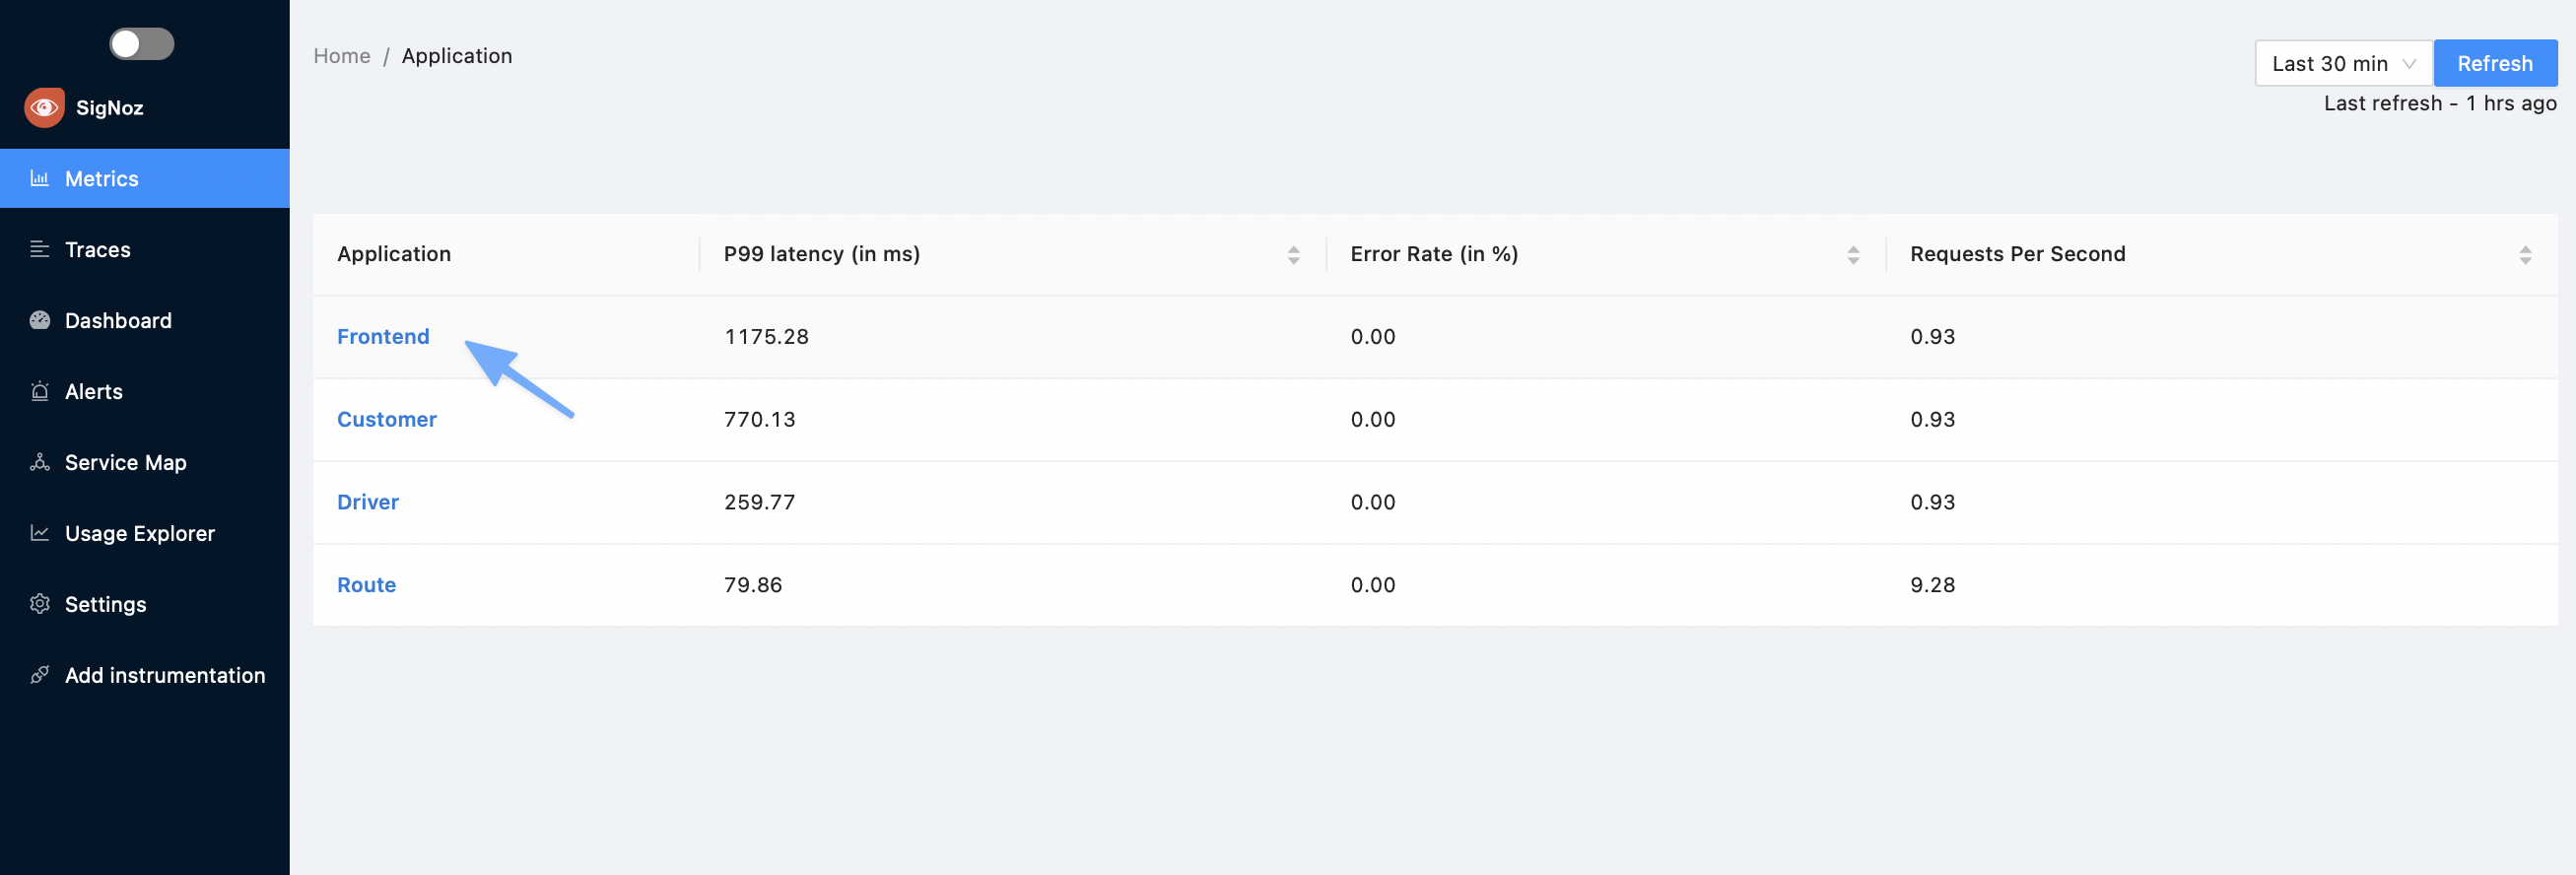
The application details pane contains three panes that are explained in the following sections:
- Application Metrics
- External Calls
- Database Calls
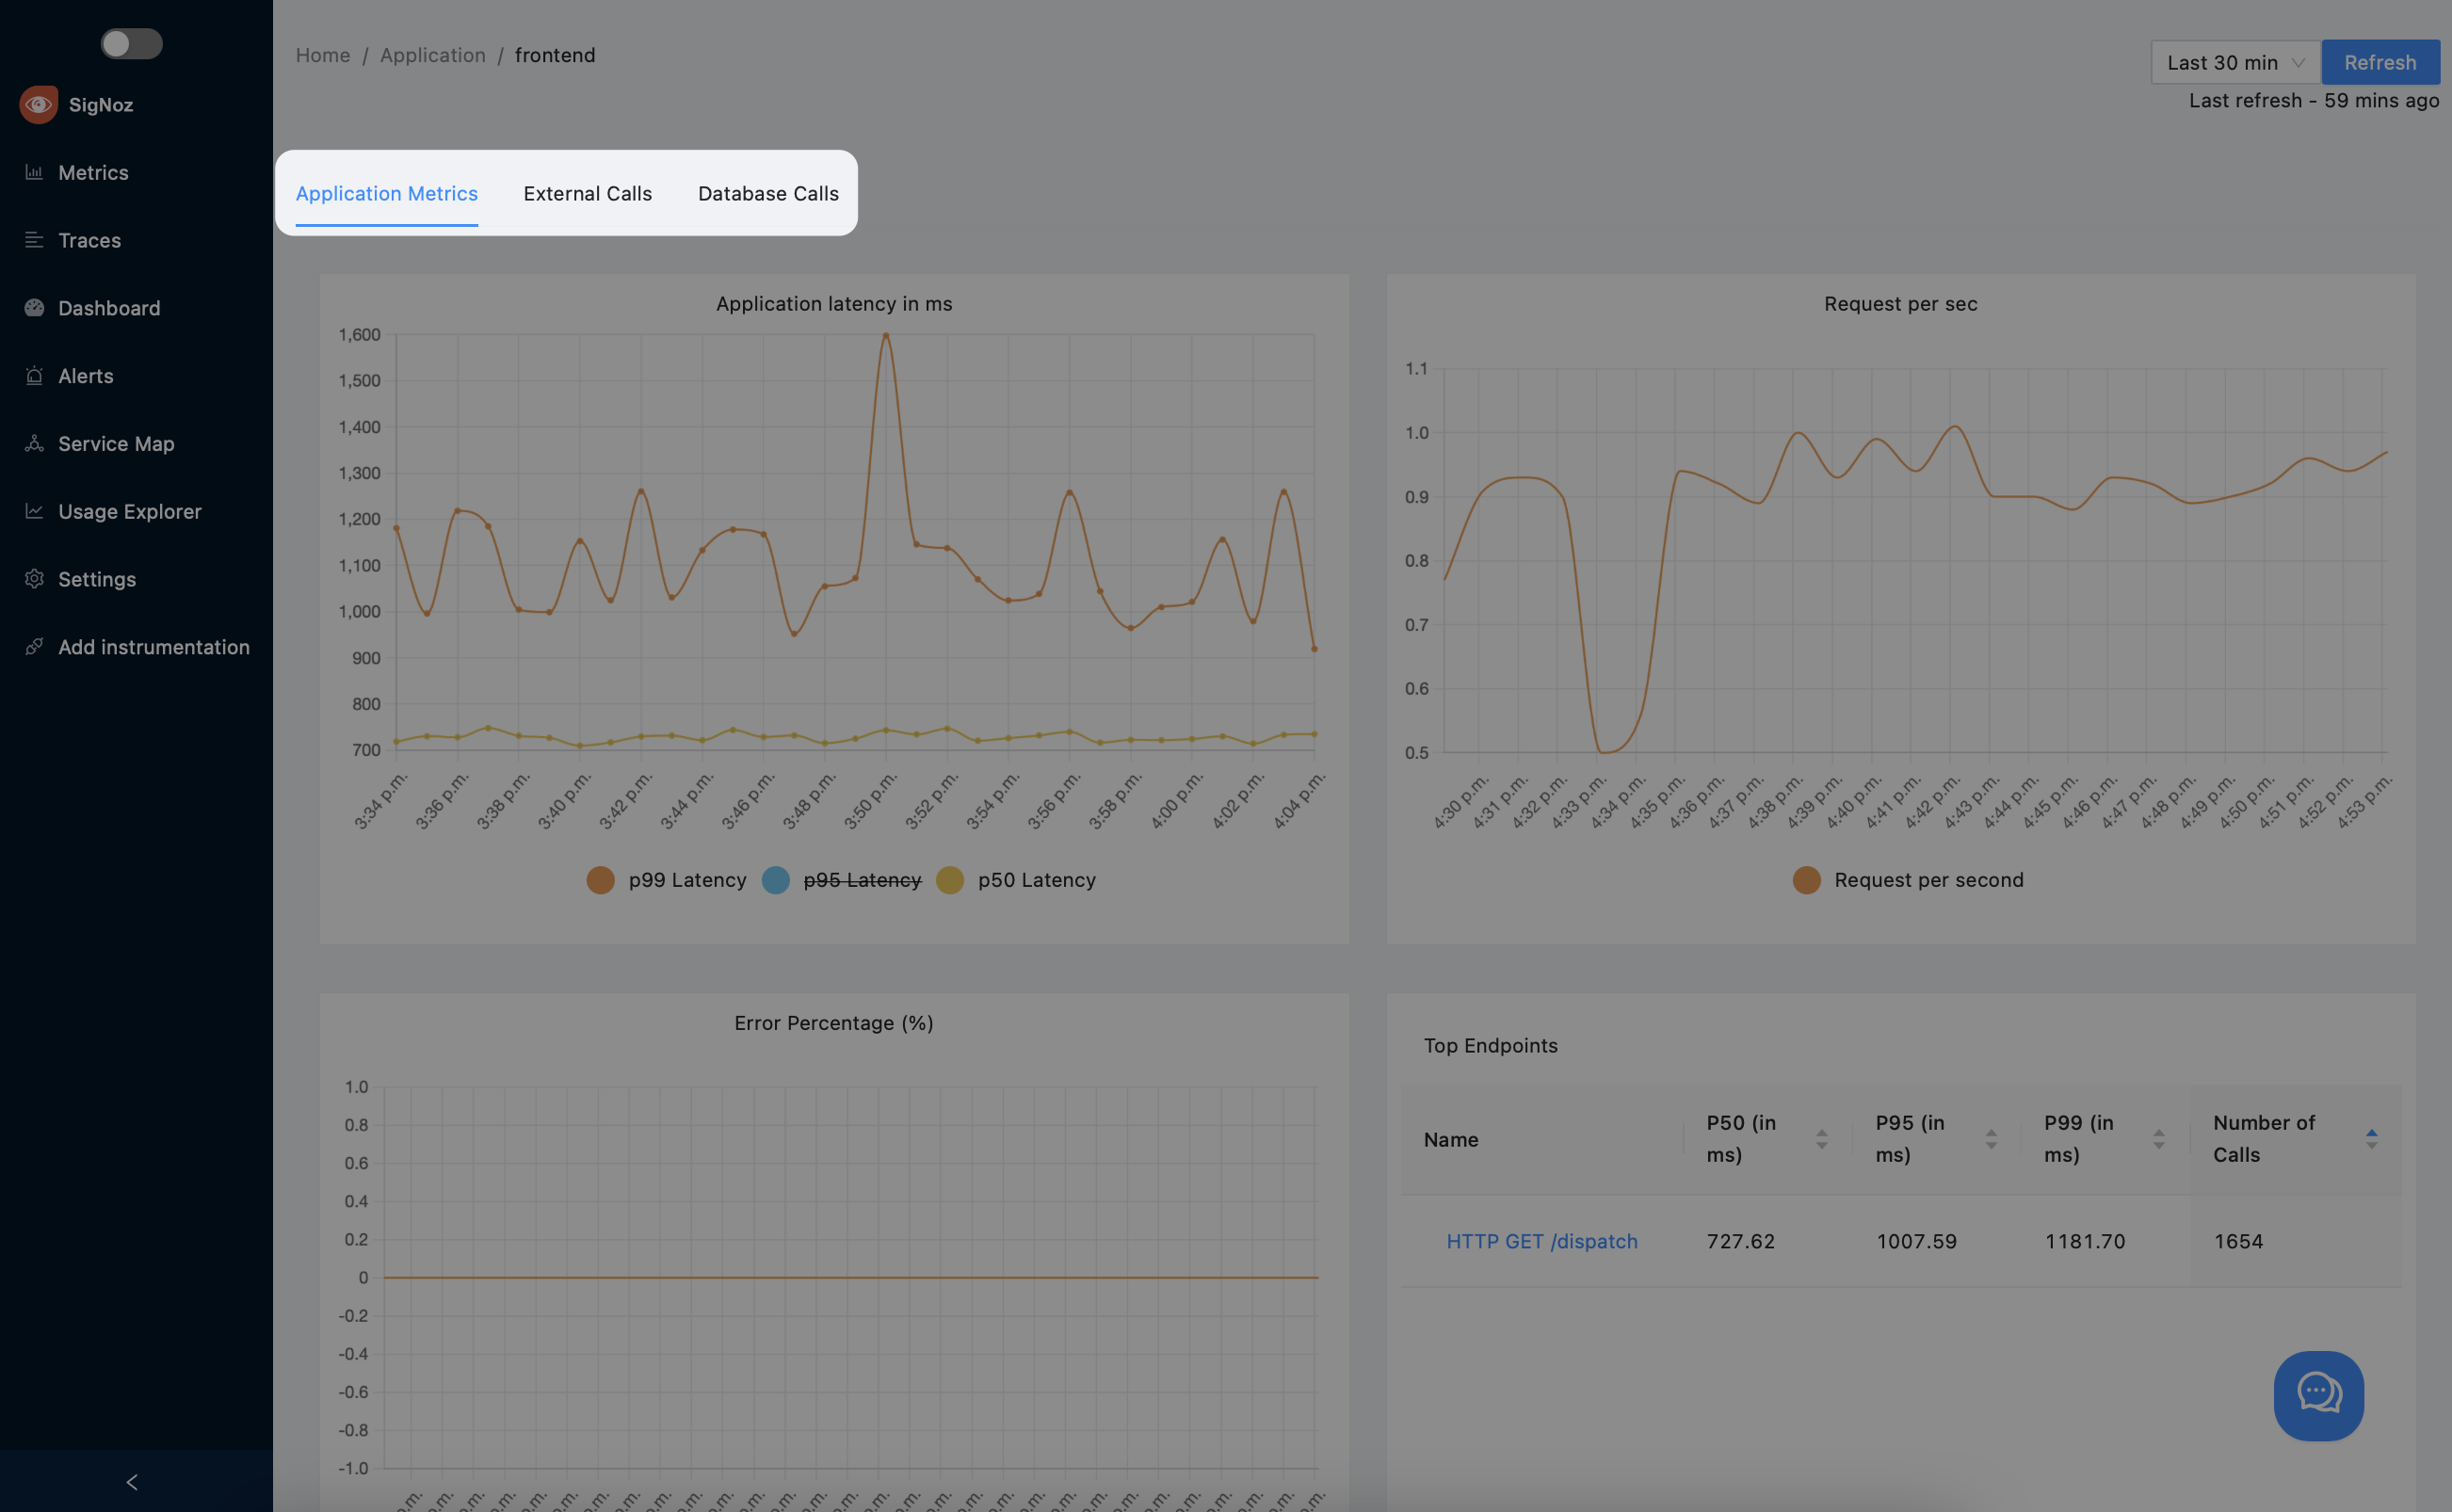
Application Metrics
The application metrics pane is comprised of four graphs:
- Application Latency in Milliseconds: this graph shows the
P99,P95, andP50latencies for the selected period of time.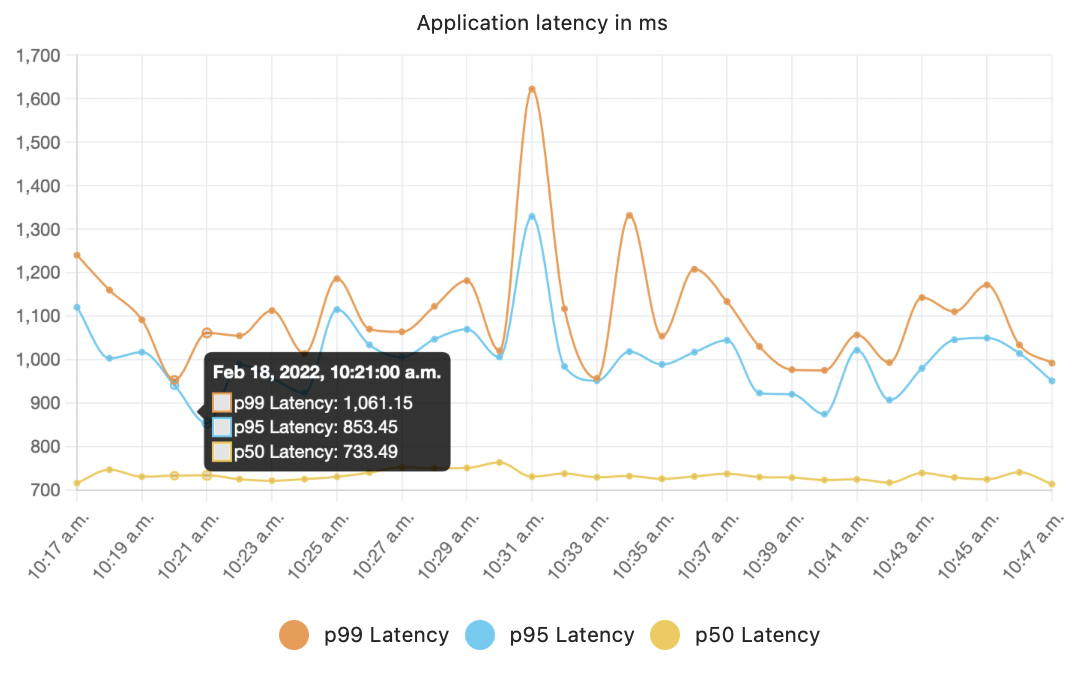
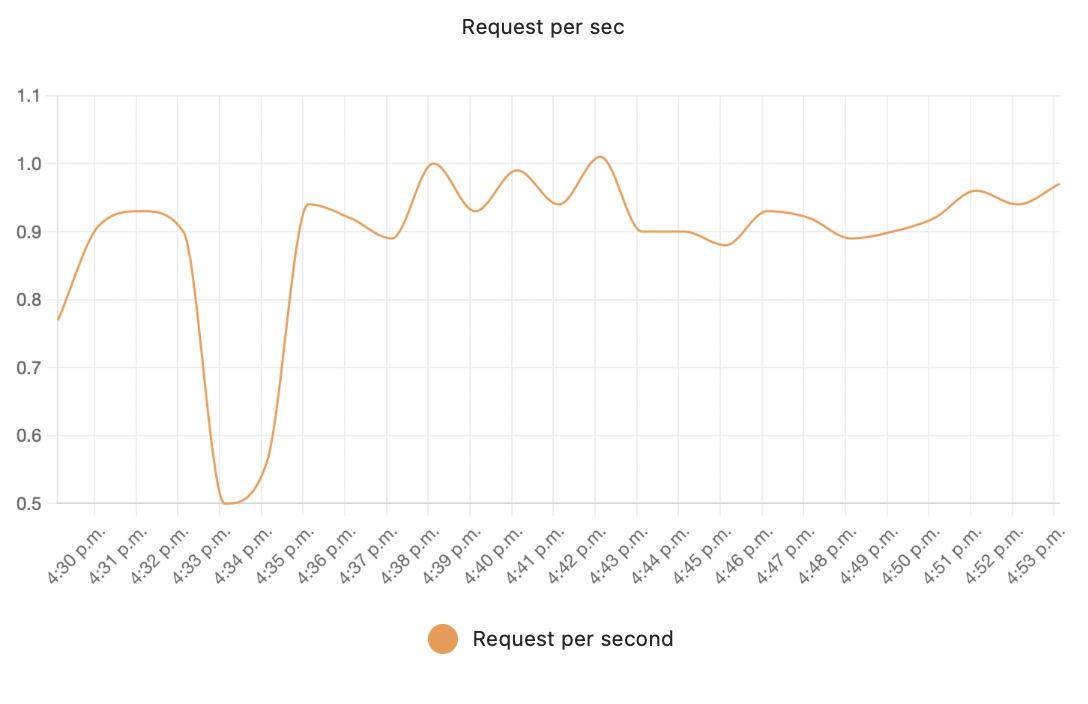
- Requests per Second: this graph shows the number of requests per second your application currently serves.
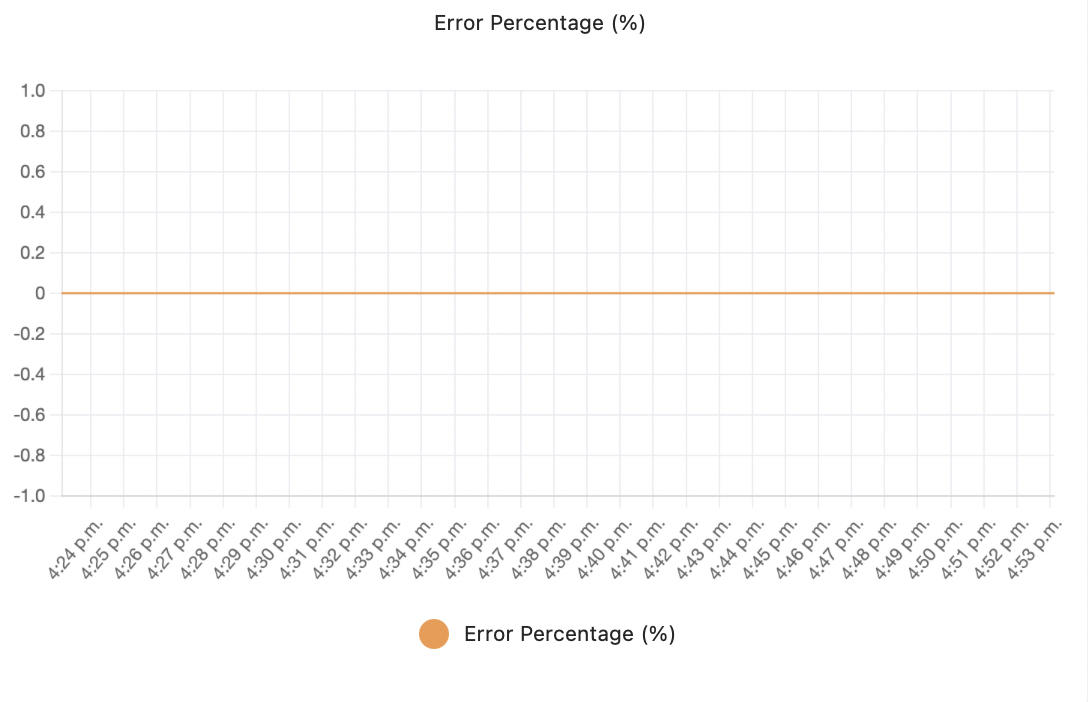
- Error Percentage: this graph shows the percentage of errors of the total sum of requests.
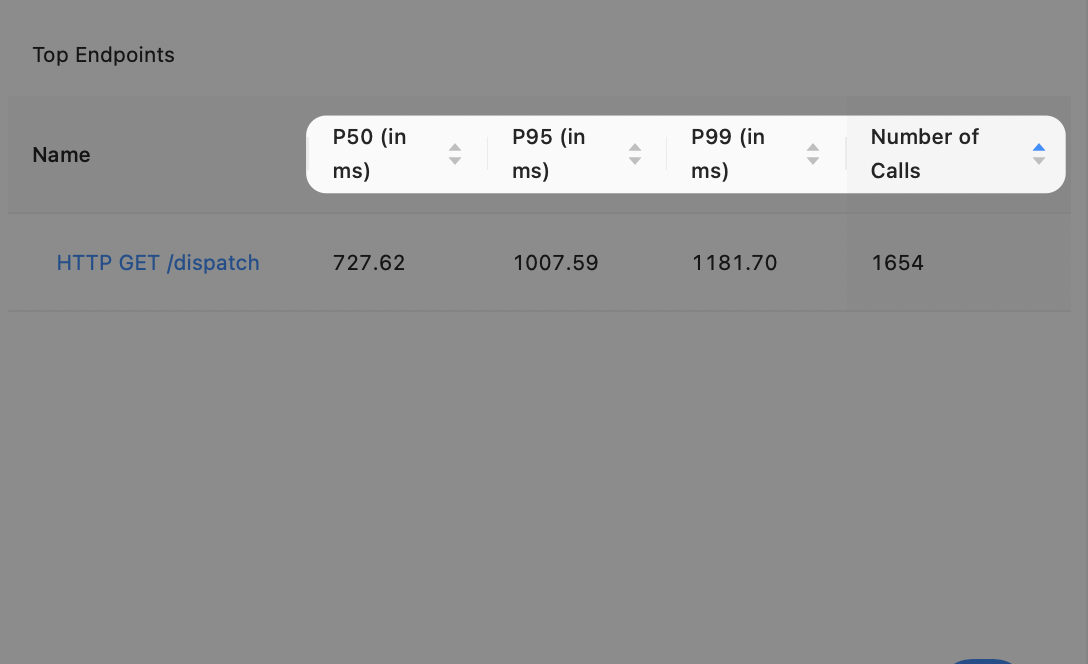
- Top Endpoints: this list helps you find the slow endpoints of your application. You can select a column heading to sort the list by the values in that column. Select the column heading again to reverse the sort order or to cancel sorting.
External Calls
The external calls pane allows you to track the external services your applications depend on. Note that these graphs do not display the interactions with your back-end components, such as database calls.
The spans should have the following span attributes to be counted in this panel
span.kind=2which means these are spans of kindSERVER. You can read more details on SpanKinds herehttp.urlshould be present as span attribute
If your services are making external calls but External Call panels show as empty, please make sure that your spans have the above attributes.
The graphs in this pane provide the following information:
- The percentage of external calls that resulted in errors.
- The average duration of all your external calls.
- The number of external calls per second by address.
- The average duration of your external calls by address.
Database Calls
This pane shows details about the database calls that your application makes. The spans should have the following span attributes to be counted in this panel
span.kind=3which means these are spans of kindCLIENT. You can read more details on SpanKinds heredb.systemshould be present as span attribute
If your services are making DB calls and your Database Call panels show as empty, please make sure that:
- Your spans have the above attributes.
- You have used appropripriate libraries for instrumenting packages which you use to make DB calls from your application
The graphs in this pane provide the following information:
- The number of database calls per second
- The average duration of your database calls. expressed in milliseconds
Get Help
If you need help with the steps in this topic, please reach out to us on Slack.