Manage Dashboards and Graphs
A dashboard is a set of one or more graphs. A graph is the basic visualization element that can either display a metric over a time interval or only the most recent value. On the Dashboard page, you can create custom dashboards, each combining multiple graphs, which you can use to get insight into how well your application is performing.
You’ll learn the following:
- How to create, update, and remove dashboards.
- How to create, update, and remove graphs.
This section uses the HotR.O.D sample application that comes preinstalled with SigNoz and generates sample data that you can query. You can apply the concepts and techniques you’ll learn to monitor your own applications.
Prerequisites
- This section assumes that your application is already instrumented. For details about how you can instrument your application, see the Instrument Your Application section.
- This section assumes that you are familiar with the basics of monitoring applications.
Open the Dashboards Section
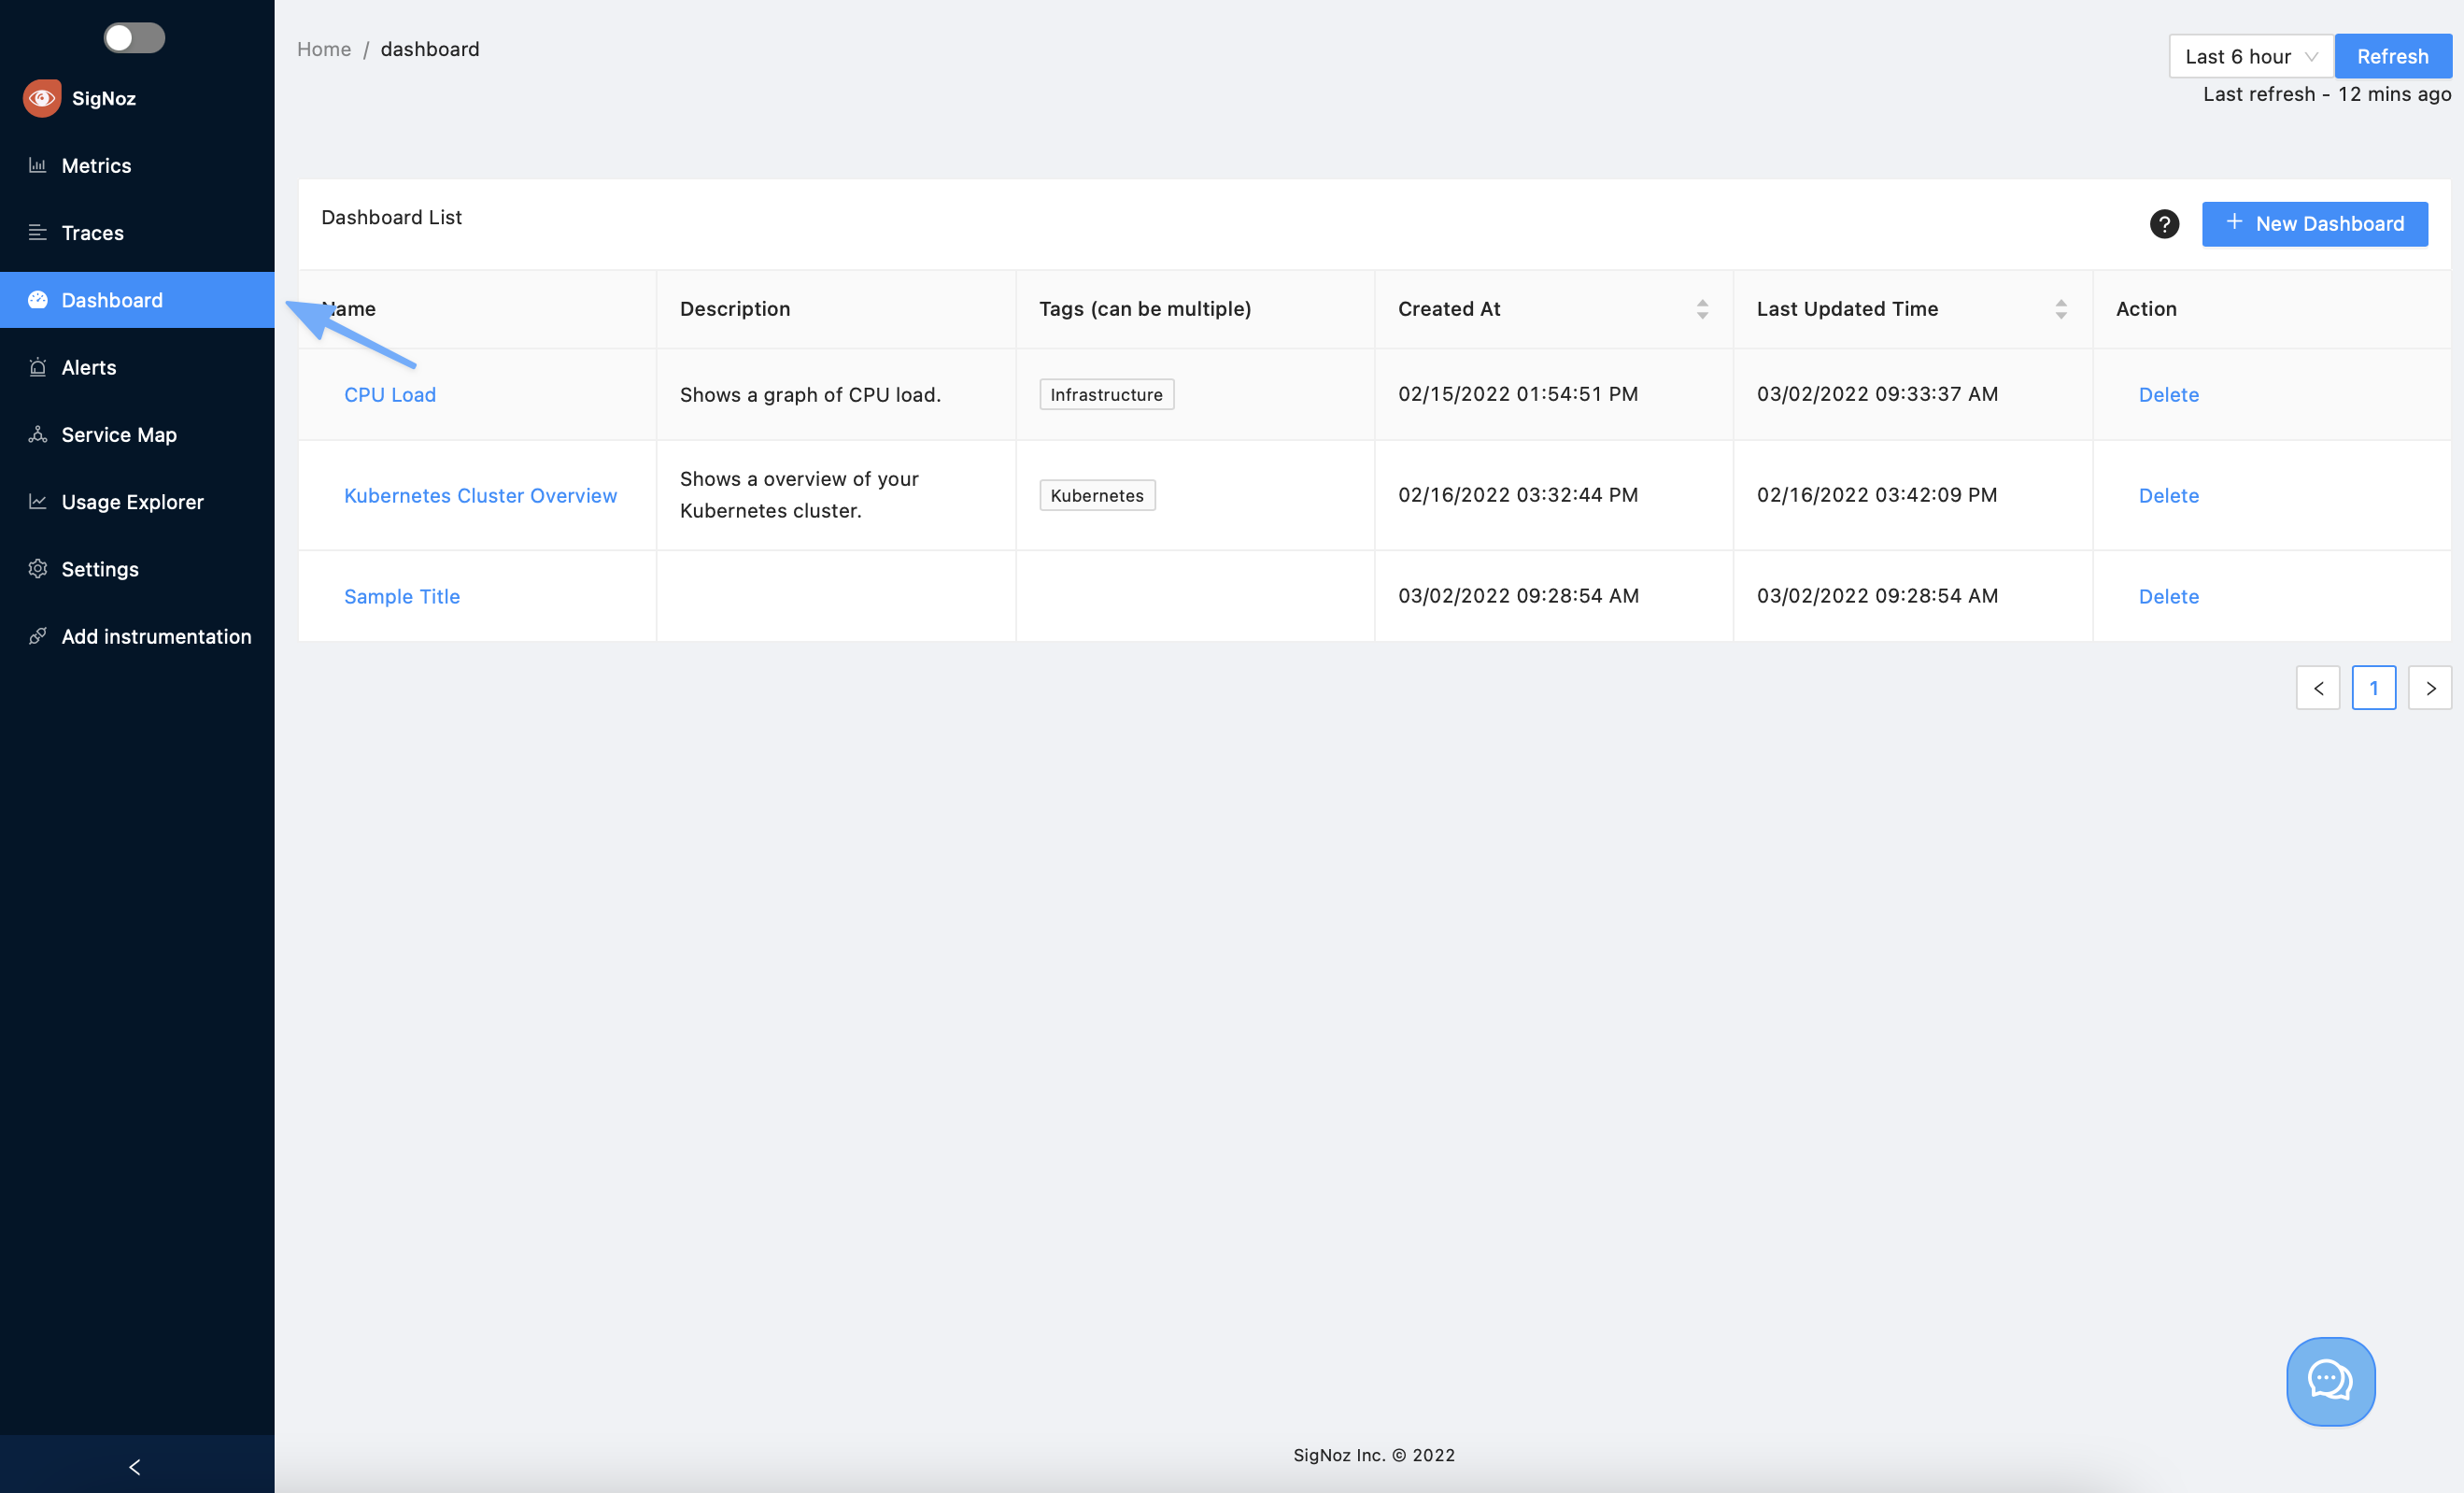
From the sidebar, select Dashboard:
Filter Dashboards
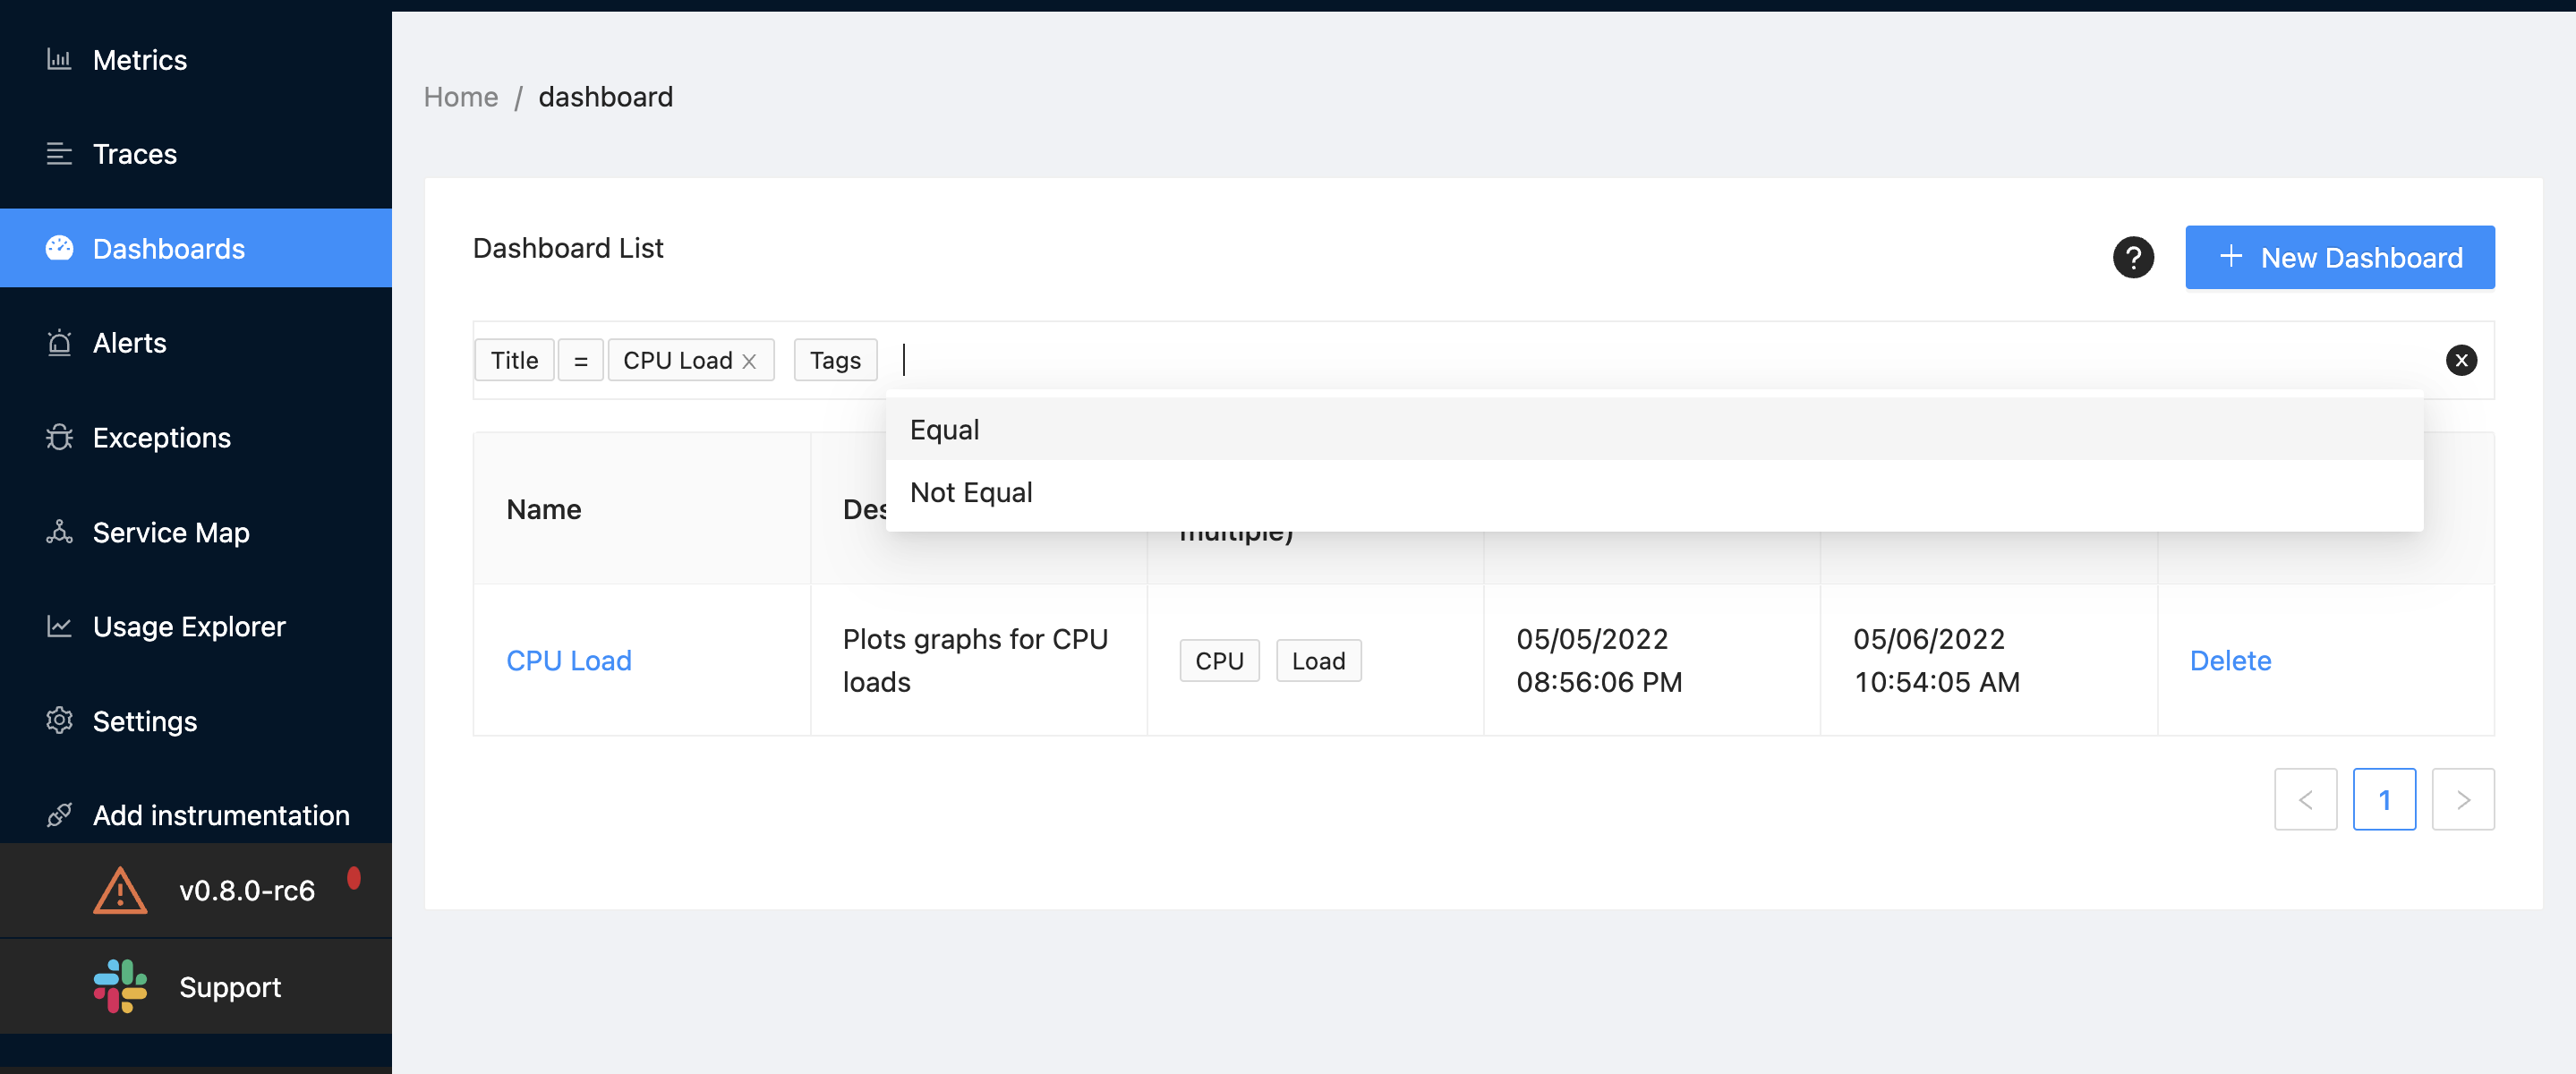
You can filter dashboards list based on Tite, Tag or Description.
Manage Dashboards
This section shows how you can create, update, and remove a custom dashboard.
Create a Custom Dashboard
- From the sidebar, choose Dashboard.
- Select the New Dashboard button.
- Select the Edit button at the far right, and then enter the following information:
- A descriptive name for your new dashboard.
- (Optional) Add one or more tags by selecting the New Tag button.
- (Optional) A brief description of your new dashboard.
- Select the Save button at the far right.
- For each graph you wish to add to your new dashboard, follow the steps Add a Graph to a Dashboard section.
- (Optional) You can change the order of your graphs by dragging and dropping them.
- When you’ve finished, select the Save Layout button.
Update a Custom Dashboard
To update the name, description, and tags:
- Select the Edit button at the far right.
- Make the changes.
- Select the Save button at the far right
To change the order of your graphs
- Drag and drop a graph to another place on the list.
- When you’ve finished, select the Save Layout button.
Remove a Custom Dashboard
- From the sidebar, choose Dashboard.
- Find the dashboard you wish to remove. Then, in the Action column, select the Delete button.
Manage Graphs
This section shows how you can create, update, and remove a graph.
Add a Graph to a Dashboard
SigNoz supports two types of graphs: time series, which displays a metric over a time interval, and value, which displays only the most recent value. To add a graph to a dashboard, follow the steps below:
- From the sidebar, choose Dashboard.
- Find the dashboard to which you want to add a new graph.
- Select Add Widget.
- Select either Time Series or Value.
- Populate the following fields:
- Panel Title: enter a descriptive name for your graph.
- Description: enter a brief description of your new graph.
- (Optional) Global Time Preference: Select the Global Time button, and use the drop-down list to specify the time range for which you want to view data. The time range you specify here overrides the global value.
- To specify the data displayed on your graph, write one or more queries in the Prometheus Querying Language (”PromQL”). To specify a legend name for your time series, you can use the Legend Format text box.
info
When you install SigNoz, only the data provided by the Hostmetric receiver is available. To enable more metric receivers, see the Send Metrics to SigNoz section.
- When you’ve finished, select the Save button.
Update a Graph
- From the sidebar, choose Dashboard.
- Find the dashboard in which you created the graph you wish to update, and then select the pencil icon located at the top right corner of your graph.
- Make the changes.
- When you’ve finished, select the Save button.
Get Help
If you need help with the steps in this topic, please reach out to us on Slack.