NodeJS OpenTelemetry Instrumentation
Requirements
- Node.js version 12 or newer
- An app to add OpenTelemetry to
Instrumenting a sample Express application
For this tutorial, we’re going to create a very simple application: an express service that responds at http://localhost:9090/hello with "Hello World".
Steps to create a sample Express application:
Git clone the sample app repo and change directory
Sample nodejs application repo on GitHub.
git clone https://github.com/SigNoz/sample-nodejs-app.git
cd sample-nodejs-appInstall the dependencies
The required OpenTelemetry packages will get installed using this command. OpenTelemetry clients have two major components: the SDK and the API. Following are the OpenTelemetry packages used for the sample application:@opentelemetry/api@opentelemetry/auto-instrumentations-node@opentelemetry/exporter-otlp-grpc@opentelemetry/sdk-node
npm iNote:
auto-instrumentations-nodeis a meta-package from opentelemetry-js-contrib that provides a simple way to initialize multiple Node.js instrumentation.
Start the Node application and start sending data to SigNoz
The
tracing.jsfile takes care of instantiating tracing for the application. You can have look at its content in the GitHub repo.Now you need to run your application with some environment variables for OpenTelemetry. Environment variables that need to be configured:
a.
IP of SigNoz backend- IP of the machine where SigNoz is installed. In case you have installed SigNoz on your local machine, you can uselocalhostb.
service_name- the service you are monitoring (you can name it anything)note
Node SDK doesn't automatically detect the
OTEL_RESOURCE_ATTRIBUTESas of today. Please edit thetracing.jsto include the service name.const sdk = new opentelemetry.NodeSDK({
resource: new Resource({
[SemanticResourceAttributes.SERVICE_NAME]: 'my-service',
}),
traceExporter,
instrumentations: [getNodeAutoInstrumentations()]
});You need to put these environment variables in the below command and run it at your terminal.
OTEL_EXPORTER_OTLP_ENDPOINT="<IP of SigNoz>:4317" \
node -r ./tracing.js index.jsIf you're running SigNoz on
localhost, and want to name your service asnode_app, the final command will be as follows:OTEL_EXPORTER_OTLP_ENDPOINT="http://localhost:4317" \
node -r ./tracing.js index.js
note
Remember to allow incoming requests to port 4317 of machine where SigNoz backend is hosted
You can check your application running at http://localhost:9090/hello. You need to generate some load in order to see data reported on SigNoz dashboard. Refresh the endpoint for 10-20 times, and wait for 2-3 mins.
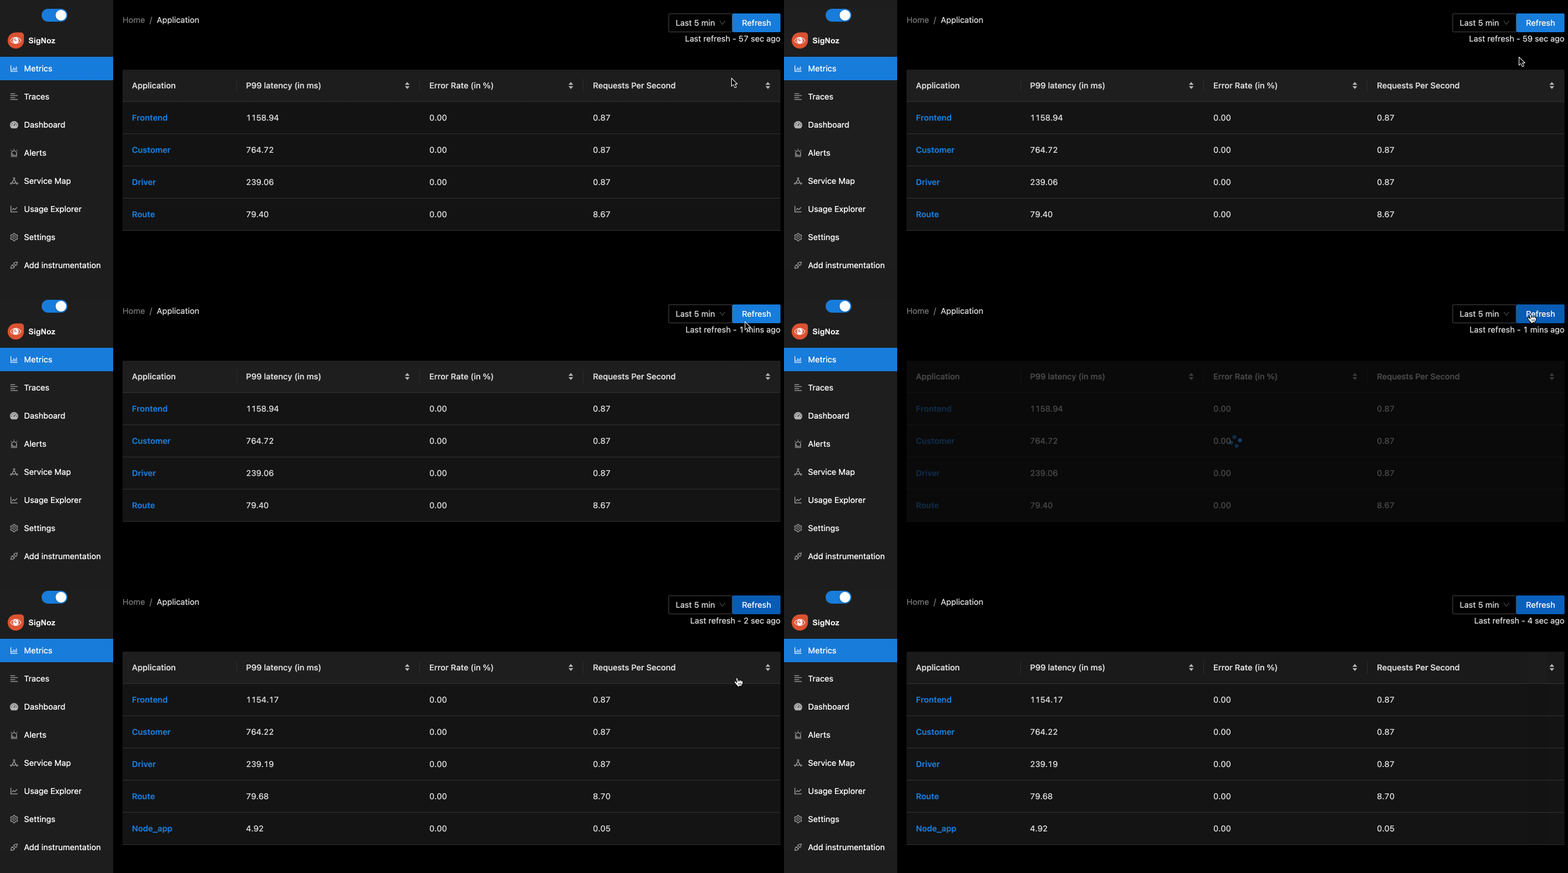
You should see your service node_app in the list of applications monitored on SigNoz dashboard as shown below.

Troubleshooting your installation
Set an environment variable to run the OpenTelemetry launcher in debug mode, where it logs details about the configuration and emitted spans:
export OTEL_LOG_LEVEL=debug
The output may be very verbose with some benign errors. Early in the console output, look for logs about the configuration. Next, look for lines like the ones below, which are emitted when spans are emitted to SigNoz.
{
  "traceId": "985b66d592a1299f7d12ebca56ca1fe3",
  "parentId": "8d62a70aa335a227",
  "name": "bar",
  "id": "17ada85c3d55376a",
  "kind": 0,
  "timestamp": 1685674607399000,
  "duration": 299,
  "attributes": {},
  "status": { "code": 0 },
  "events": []
}
{
  "traceId": "985b66d592a1299f7d12ebca56ca1fe3",
  "name": "foo",
  "id": "8d62a70aa335a227",
  "kind": 0,
  "timestamp": 1585130342183948,
  "duration": 315,
  "attributes": {
    "name": "value"
  },
  "status": { "code": 0 },
  "events": [
    {
      "name": "event in foo",
      "time": [1585130342, 184213041]
    }
  ]
}
Running short applications (Lambda/Serverless/etc) If your application exits quickly after startup, you may need to explicitly shutdown the tracer to ensure that all spans are flushed:
opentelemetry.trace.getTracer('your_tracer_name').getActiveSpanProcessor().shutdown()
Frequently Asked Questions
How to find what to use in
IP of SigNozif I have installed SigNoz in Kubernetes cluster?Based on where you have installed your application and where you have installed SigNoz, you need to find the right value for this. Please use this grid to find the value you should use for
IP of SigNozI am sending data from my application to SigNoz, but I don't see any events or graphs in the SigNoz dashboard. What should I do?
This could be because of one of the following reasons:
Your application is generating telemetry data, but not able to connect with SigNoz installation
Please use this troubleshooting guide to find if your application is able to access SigNoz installation and send data to it.
Your application is not actually generating telemetry data
Please check if the application is generating telemetry data first. You can use
Console Exporterto just print your telemetry data in console first. Join our Slack Community if you need help on how to export your telemetry data in consoleYour SigNoz installation is not running or behind a firewall
Please double check if the pods in SigNoz installation are running fine.
docker psorkubectl get pods -n platformare your friends for this.
