FastAPI OpenTelemetry Instrumentation
Introduction to SigNoz for FastAPI
SigNoz can help you monitor your FastAPI applications for application related metrics like latency, request per second, error rates, etc. It can also monitor infrastructure metrics like CPU utilization and memory usage.
You can set alerts on metrics of your choice to stay on top of any issues arising in your deployed application.
Getting started for FastAPI with SigNoz
SigNoz uses OpenTelemetry for enabling your application code to generate telemetry data. OpenTelemetry provides a vendor-neutral specification to instrument your application so that you can export data to any backend of your choice, such as SigNoz.
Let us see how to instrument your application with OpenTelemetry, so that you can visualize the data with SigNoz.
Instrumenting a sample FastAPI application with OpenTelemetry
Prerequisites Python 3.6 or newer
Running sample FastAPI app
We will be using the FastAPI app at this Github repo.git clone https://github.com/SigNoz/sample-fastAPI-app.git
cd sample-fastapi-app/
cd appInstall necessary OpenTelemetry Python packages
pip3 install -r requirements.txtThe
requirements.txtfile contain all the necessary OpenTelemetry packages.Install application specific packages
opentelemetry-bootstrap --action=installConfigure environment variables to run app and send data to SigNoz
caution
Run this command at your terminal after replacing the environment variables applicable for your setup.
Now you need to run your application with some environment variables for OpenTelemetry. Environment variables that need to be configured:
a.
IP of SigNoz backend- IP of the machine where SigNoz is installed. In case you have installed SigNoz on your local machine, you can uselocalhostb.
service name- the service you are monitoring (you can name it anything)note
Don’t run app in reloader/hot-reload mode as it breaks instrumentation.
You need to put these environment variables in the below command and run it at your terminal.
OTEL_RESOURCE_ATTRIBUTES=service.name=<service_name> \
OTEL_EXPORTER_OTLP_ENDPOINT="http://<IP of SigNoz>:4317" \
opentelemetry-instrument uvicorn main:app --host localhost --port 5002If you're running SigNoz on localhost, and want to name your service as fastapiApp, the final command will be as follows:
OTEL_RESOURCE_ATTRIBUTES=service.name=fastapiApp \
OTEL_EXPORTER_OTLP_ENDPOINT="http://localhost:4317" \
opentelemetry-instrument uvicorn main:app --host localhost --port 5002You can check if your application is running or not by hitting the endpoint at http://localhost:5002/.
Generate load on your app to see data on SigNoz dashboard
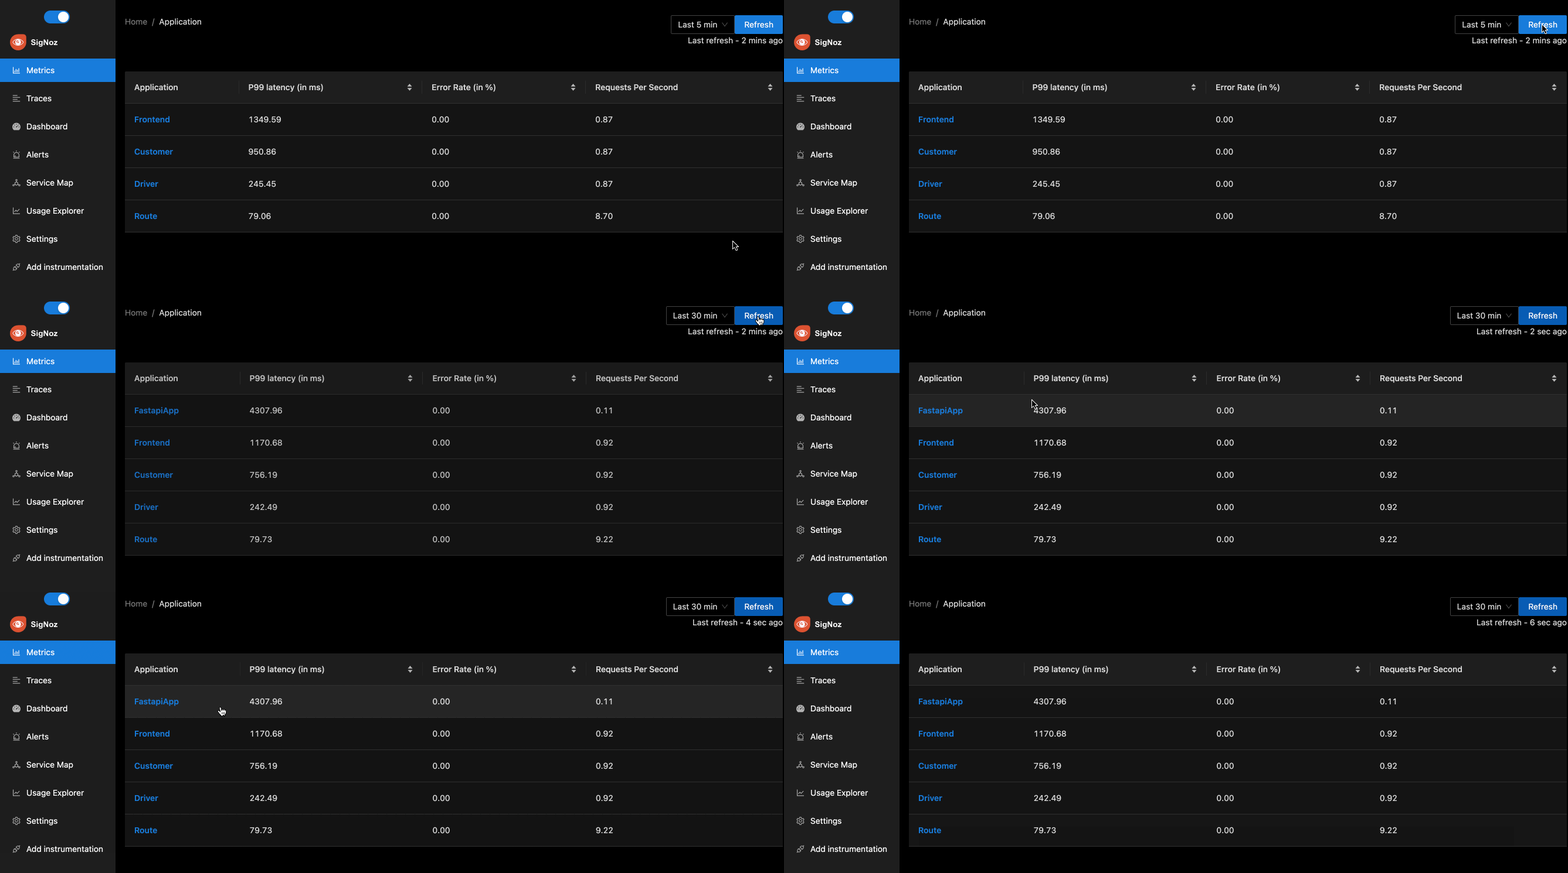
You can use locust for this load testing.pip3 install locustlocust -f locust.py --headless --users 10 --spawn-rate 1 -H http://localhost:5002Now refresh the SigNoz dashboard. You should see your service
fastapiAppin the list of applications monitored on SigNoz dashboard as shown below.
Instructions for running with Docker
Build Docker image
docker build -t sample-fastapi-app .Setting environment variables
# If you have your SigNoz IP Address, replace <IP of SigNoz> with your IP Address.

docker run -d --name fastapi-container \
-e OTEL_METRICS_EXPORTER='none' \
-e OTEL_RESOURCE_ATTRIBUTES='service.name=fastapiApp' \
-e OTEL_EXPORTER_OTLP_ENDPOINT='http://<IP of SigNoz>:4317' \
-p 5002:5002 sample-fastapi-appIf you're using docker-compose setup:
# If you are running signoz through official docker-compose setup, run `docker network ls` and find clickhouse network id. It will be something like this clickhouse-setup_default
# and pass network id by using --net <network ID>

docker run -d --name fastapi-container \
--net clickhouse-setup_default  \
--link clickhouse-setup_otel-collector_1 \
-e OTEL_METRICS_EXPORTER='none' \
-e OTEL_RESOURCE_ATTRIBUTES='service.name=fastapiApp' \
-e OTEL_EXPORTER_OTLP_ENDPOINT='http://clickhouse-setup_otel-collector_1:4317' \
-p 5002:5002 sample-fastapi-app
Frequently Asked Questions
How to find what to use in
IP of SigNozif I have installed SigNoz in Kubernetes cluster?Based on where you have installed your application and where you have installed SigNoz, you need to find the right value for this. Please use this grid to find the value you should use for
IP of SigNozI am sending data from my application to SigNoz, but I don't see any events or graphs in the SigNoz dashboard. What should I do?
This could be because of one of the following reasons:
Your application is generating telemetry data, but not able to connect with SigNoz installation
Please use this troubleshooting guide to find if your application is able to access SigNoz installation and send data to it.
Your application is not actually generating telemetry data
Please check if the application is generating telemetry data first. You can use
Console Exporterto just print your telemetry data in console first. Join our Slack Community if you need help on how to export your telemetry data in consoleYour SigNoz installation is not running or behind a firewall
Please double check if the pods in SigNoz installation are running fine.
docker psorkubectl get pods -n platformare your friends for this.
